Home
Tutotial: Lamellar structures
Tutorial contributors: Andreas Haahr Larsen, Jacob Judas Kain Kirkensgaard.
Frontpage image from Luchini and Vitiallo 2021
Before you start
- Download and install SasView (for Part 3)
Learning outcomes
- Understand how the scattering from lamellar structures looks (unilammellar vesicles, multilamellar vesicles).
- Calculate SLDs and fit SAXS data of lamellar structures using SasView.
Part 1: Visual inspection of data
- You have measured two SAXS datasets:
- Sample1_clean.dat: DPPC in H2O
- Sample2_clean.dat: lecithin extract of unknown composition, but expected to contain much DPPC, also in H2O.
The scientific question is: what structure do of the different lipids form? The samples are either unilamellar vesicles or multilamellar vesicles:
Figure from Luchini and Vitiallo 2021 (reprinted with permission). Load the data into SasView and create a new plot:

Comment on the differences. Which is which? What do the the peaks of Sample1.dat represent and can you derive any structural info from their position (q-value)? (Hint)
Part 2: Pair distance distribution (this part can be skipped)
A measured SAXS signal is, basically, a Fourier transformation of the irradiated sample. Therefore one can try to Fourier tranform the data back, to get structural information (without having to do any fitting).
Note: there is a separate tutorial on Fourier tranformation of small-angle scattering data, and the pair distance ditribution.
Go to: BayesApp, which is a web applicatioin for doing indirect Fourier transformation of small-angle scattering data.
Upload the Sample2.dat datafile to BayesApp, choose Transformation: Negative (to allow for negative values of the pair distance distribution). Give an estimate for the maximum distance, e.g. 500 Å, set qmax to 0.5 Å-1, and press Submit:
For Sample1.dat, you need to increase the number of points in p(r) from the default 70 to, e.g., 200 (under Advanced options). This makes BayesApp slower, but allows it to better fit the Bragg peaks. Also, provide a larger estimate of the maximum distance, e.g. 800 Å. Press submit:
Comment on the result. If you are not familiar with pair distributions, you can take the tutorial on that subject: Pair distance distribution.
Note: BayesApp also assesses the error bars in data, and if it assess them to be over- or underestimated, it provides a rescaled dataset (Larsen and Pedersen 2021). Albeit useful, you can ignore that for now.
Part 3: Fit the data with an analytical model
Before we fit the data, we need to consider all prior knowledge. This is critical because fitting SAS data is an ambiguous inverse problem, i.e. there are several models that can fit the data. First and foremost, we must estimate the scattering length densities (SLD) and excess scattering length density (ΔSLD = SLD - SLDH2O) of DPPC head and tail groups.
The molecular volumes can be determined experimentally and are 30 Å3 for H2O, 325 Å3 for DPPC head grops and 969 Å3 for DPPC tail groups. Use SasView Density/Volume calculator (Tool -> Density/Volume calculator) to get the mass densities. You need to type in the chemical formula and molar volume - be aware of unit conversion (Hint).
Then use SasView SLD calculator to get the SLD values for solvent, head and tail group (Solution).
Use the SasView models lamellar_hg (unilamellar vesicles) or lamellar_hg_stack_caille (multilamellar vesiceles) to fit the data. Start with Sample2.dat, is this has the least features (see Part 1).
Select the dataset, press "Send data to" and select "Fitting" in the menu. Choose one of the models (under the category: Lamellae). Always start with the simplest (in this case, that is lamellar_hg, unilamellar vesicles). You can add complexity if the simpler model does not fit data.
Before you fit the data, type in reasonable values for all parameters. DPPC has a tail length of 10-15 Å and a head length of 2-5 Å.
When fitting a model to SAXS data, you would often not fit all parameters at once, you may follow this "protocol":
- Calculate the scattering from the model (no fitting yet) by pressing "Compute/Plot".
- Ignore the first point, by setting qmin to 0.01 (under Fit Options). Ignore the last points by setting qmax=0.5
- Fit scale and backbround (set a check-mark there and press "Fit"). Keep other parameters fixed
- You may try to vary the parameters one at a time and press "Compute/Plot" to investigate what effect it has on the calculated scattering.
- Now, try to fit the length_tail and length_head (together with scale and background). This should give a reasonable fit. You may have to fix length_tail or set an upper limit, as, for some reason, a good fit can be achieved for Sample2 with length_tail of around 15, which is unrealistic.
- In the end, you may try to refine the scattering lengths densities, that you calculated. They should not be too different from the calculated values. If you fit all SLDs (also solvent SLD), then you get "nan" as error-estimate on that parameter - why? (Hint)
For the model lamellar_hg_stack_caille (multilamellar vesiceles), there are some additional steps in the fitting protocol:
- Before fitting, estimate a good initial value for d (see Part 2) and Nlayers (see Part 3).
- Ignore the first point, by setting qmin to 0.01 (under Fit Options). Ignore the last points by setting qmax=0.5
- Try to estimate d_spacing, by fitting this parameter together with scale and background and Caille_parameter.
- (OBS: the model lamellar_hg_stack_caille has a bug, so Nlayers cannot be fitted - try to vary it manually instead.)
- Then fit the length_tail and length_head. Are the values reasonable? else, try to fix one or set min/max values.
- In the end, refine the scattering lengths densities. They should not be too different from the calculated values.
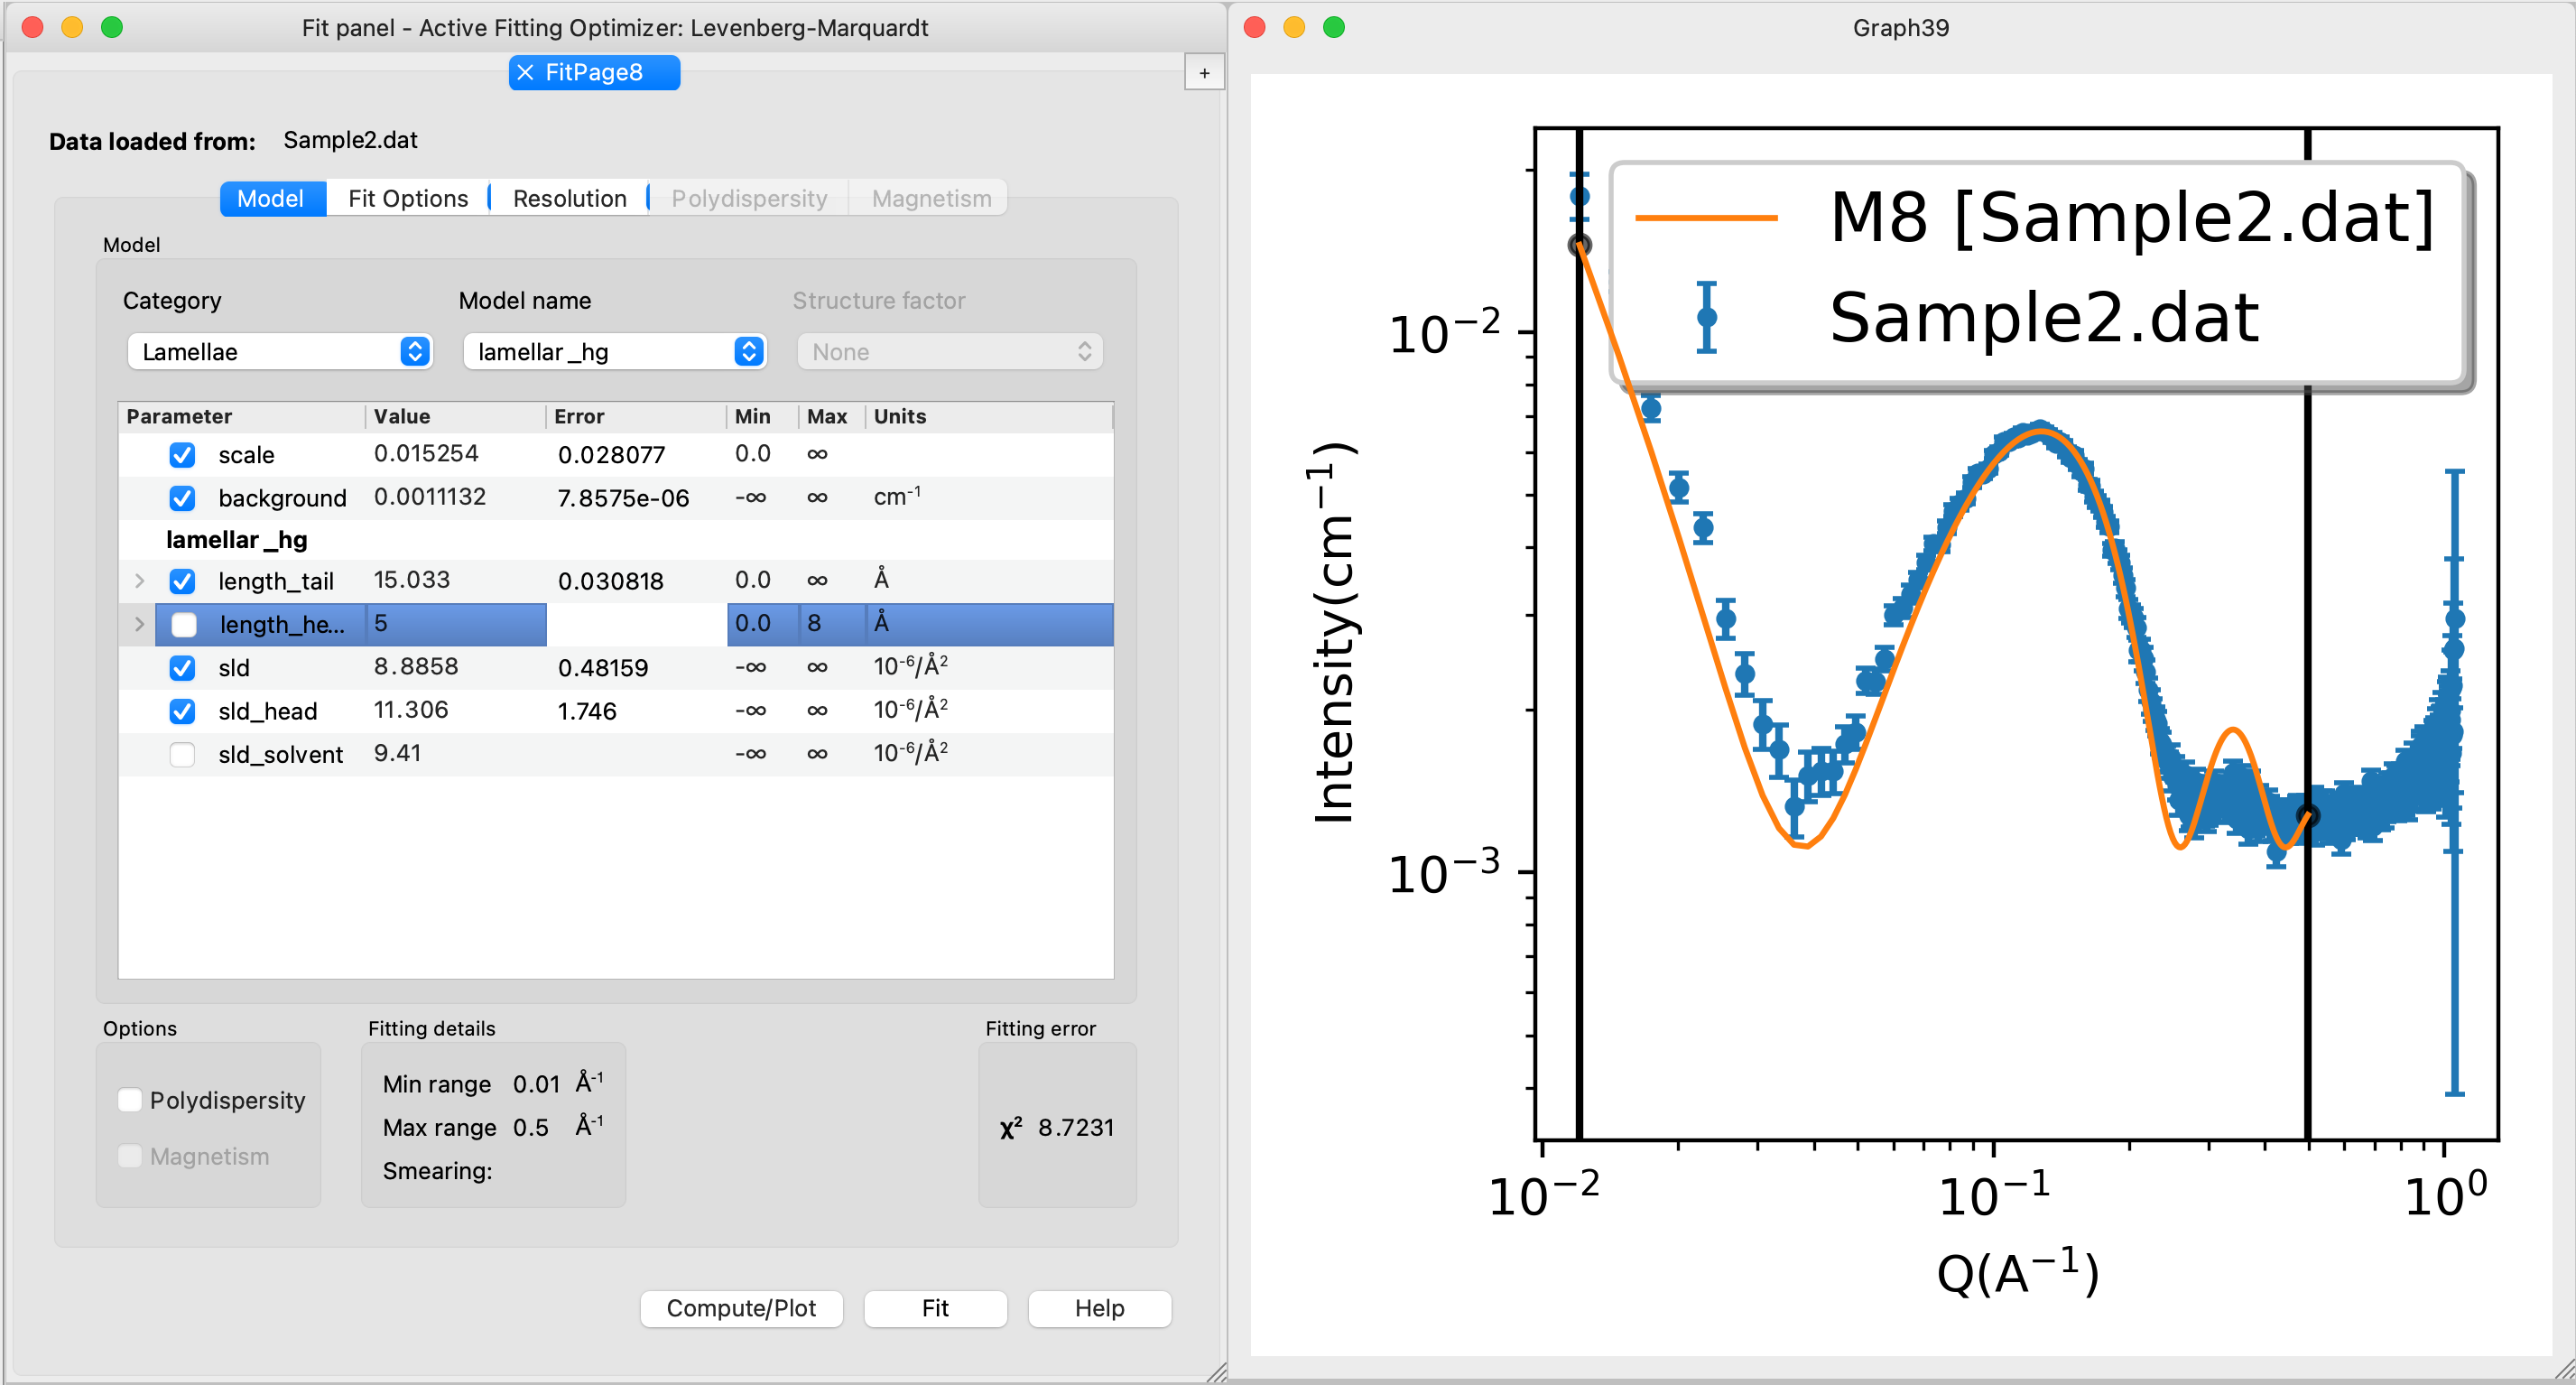
The fit may look like this for Sample2:
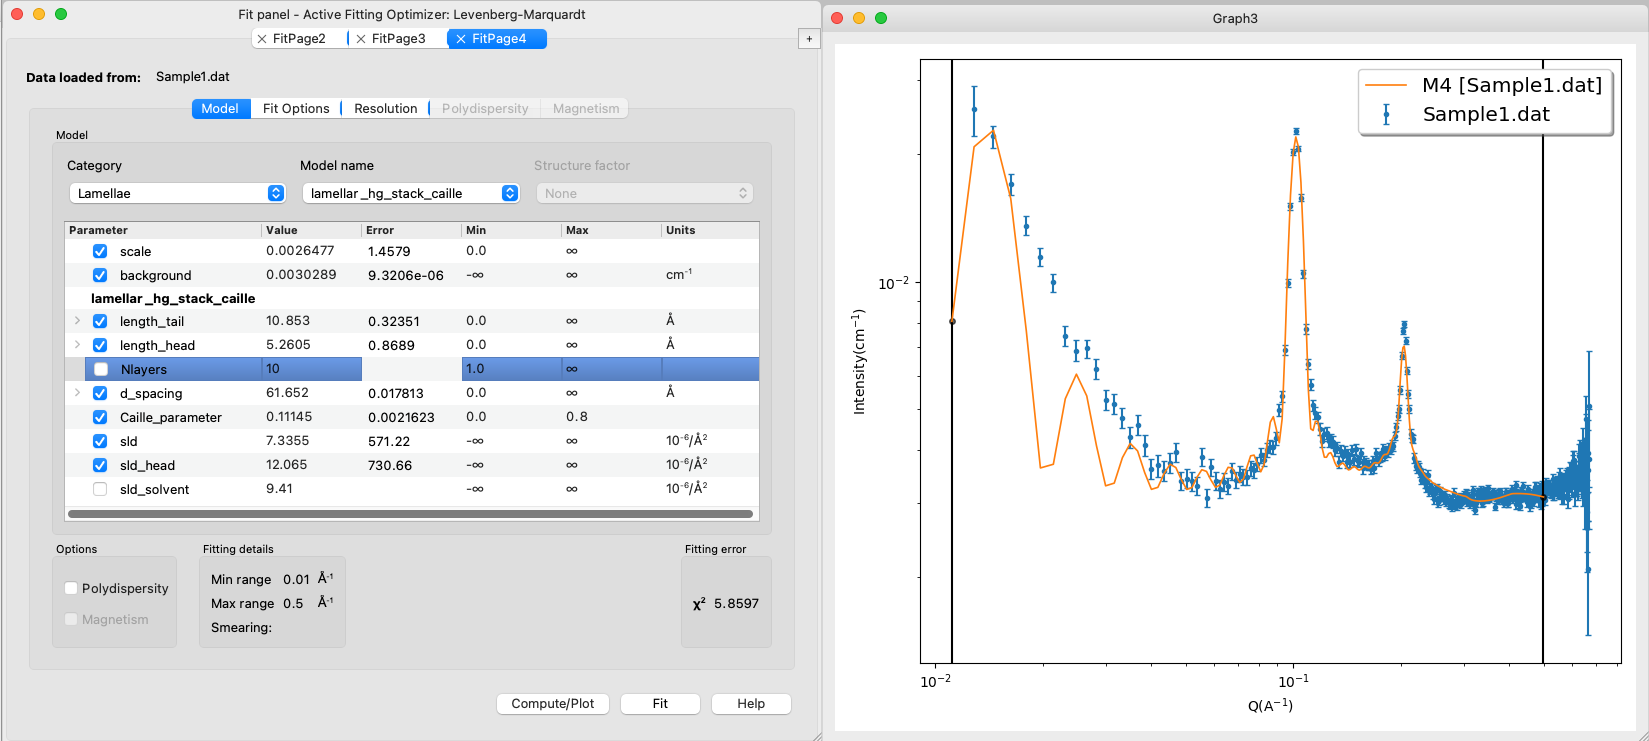
And like this for Sample1:
Comments on the results. You may not get perfect fits (reduced χ 2 are not unity) - this is ok. This means that the models are not perfect - how could the models be improved? (Hint)
The goal was not to obtain perfect fits, but to answer relevant scientific questions: what phase does the two lipid mixtures form? - the models are sufficently good to answer that question. And to answer other questions, e.g., how does the structure change if we change temperature, lipid composition (e.g., a more biologically relevant compositions), concenttration, etc